Why Observability for Agents
AI agents differ from traditional applications in execution characteristics:Risk in reasoning chains
Unsafe behavior emerges in multi-step interactions and context propagation
Dynamic tool invocation
Agents make runtime decisions about which tools to use and when
Complex execution flows
Nested operations, parallel tasks, and async execution create intricate traces
Behavioral drift
Changes in reasoning patterns or model behavior go undetected
What Cascade Tracks
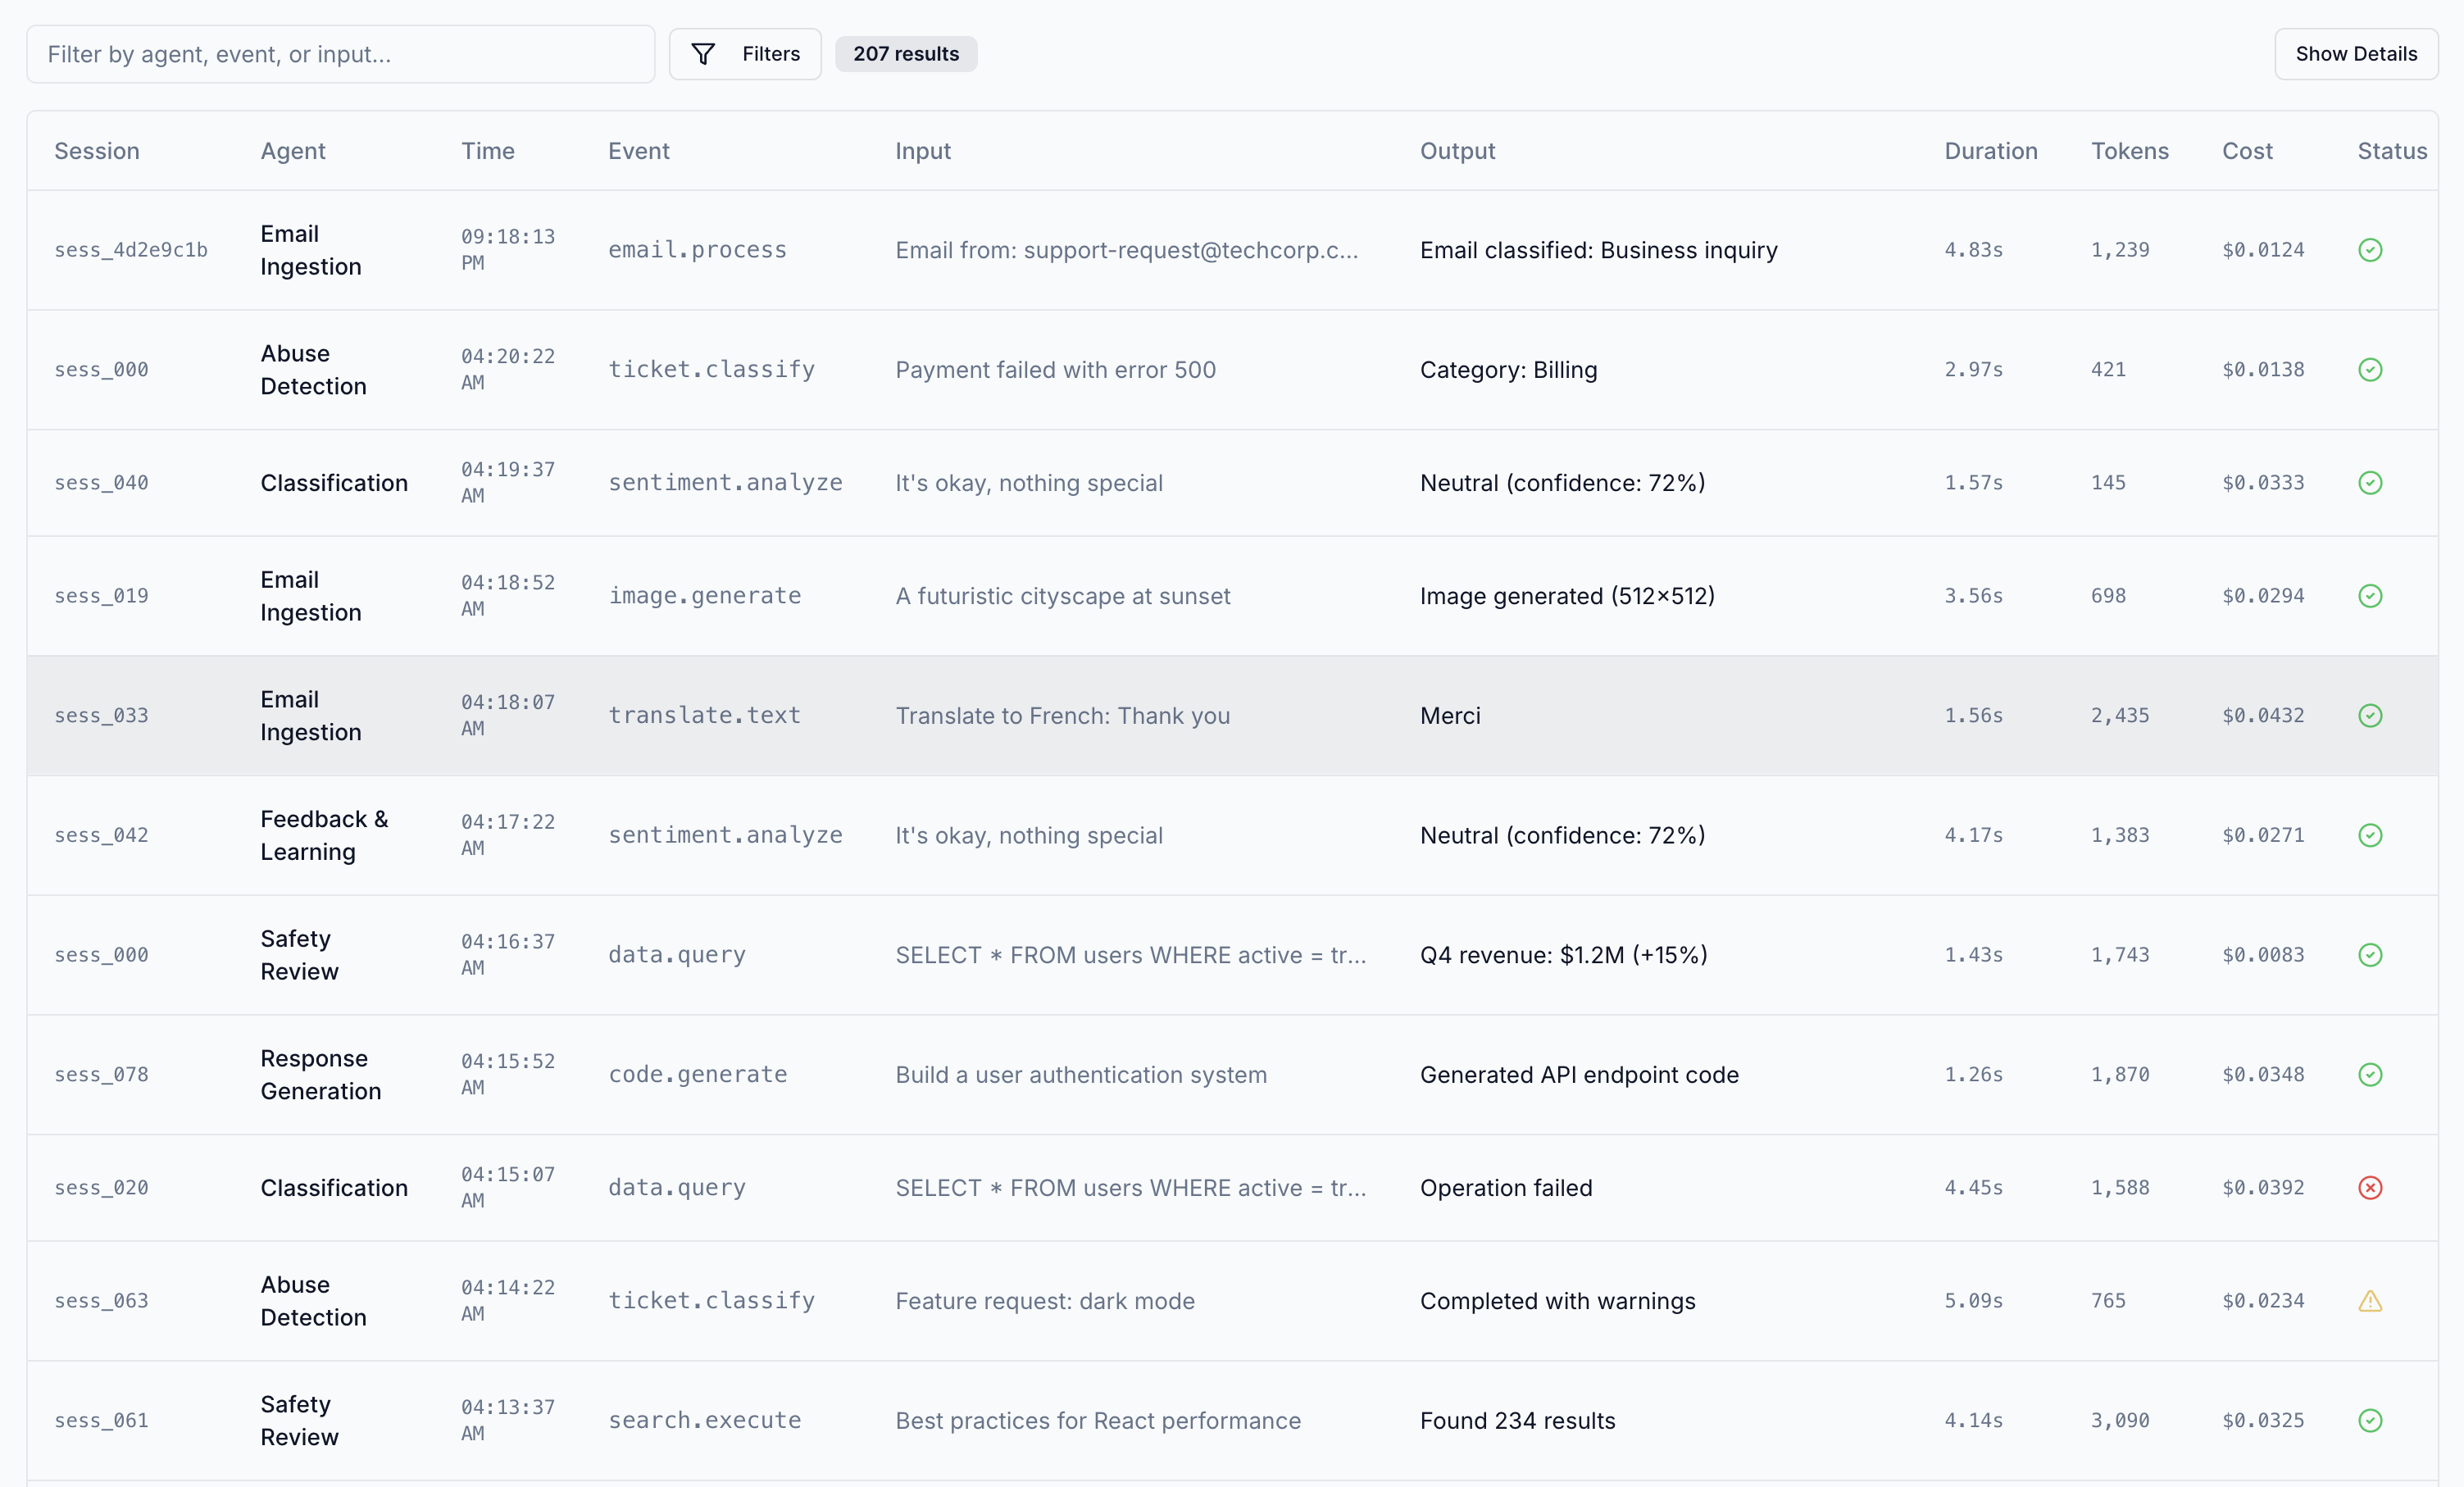
Cascade automatically captures telemetry across agent execution.Traces
Hierarchical representation of agent execution flow.What traces capture
What traces capture
- Parent-child relationships between operations
- Complete execution timeline from start to finish
- Visual trace trees for understanding flow
- Nested operation context to see how components interact
LLM Calls
Every interaction with language models is captured in full detail.Prompt tracking
Prompt tracking
- Complete prompts with all variables resolved
- System messages and instructions
- User messages and conversation history
Response tracking
Response tracking
- Full completion text
- Token usage (input, output, total)
- Estimated costs per model
- Response latency in milliseconds
Model parameters
Model parameters
- Temperature, top_p, and other sampling parameters
- Model name and version
- Provider information
Tool Executions
Function and tool invocations with complete execution details.| Metric | Description |
|---|---|
| Input parameters | All arguments passed to the tool |
| Output results | Return values or data produced |
| Execution duration | Time taken to complete |
| Success/failure status | Whether the tool executed successfully |
Use Cases
Observability data supports several workflows: Debugging - Replay exact execution flows to understand failures and unexpected behavior. Trace context shows the full sequence of operations leading to an error. Security threat detection - Identify adversarial manipulation including prompt injection, data exfiltration, and context poisoning. Full prompt and completion traces reveal attacks that bypass traditional security controls. Behavioral validation - Detect drift in agent reasoning, tool selection, and output patterns. Statistical baselining and semantic analysis surface changes that indicate misalignment or degradation. Incident investigation - Replay exact execution flows to understand safety violations, security incidents, and unexpected behavior. Trace context shows the complete sequence of operations, reasoning steps, and tool invocations that led to an event.Next Steps
To get started with observability in Cascade:- Instrument your agent with the Cascade SDK
- Wrap your LLM client with
wrap_llm_client() - Use
trace_run()to group operations into logical workflows - View traces in the Cascade Dashboard