What are traces?
A trace represents a single execution of your AI agent from start to finish. It captures the complete workflow of every LLM call, tool invocation, and function execution as a hierarchical tree of operations called spans.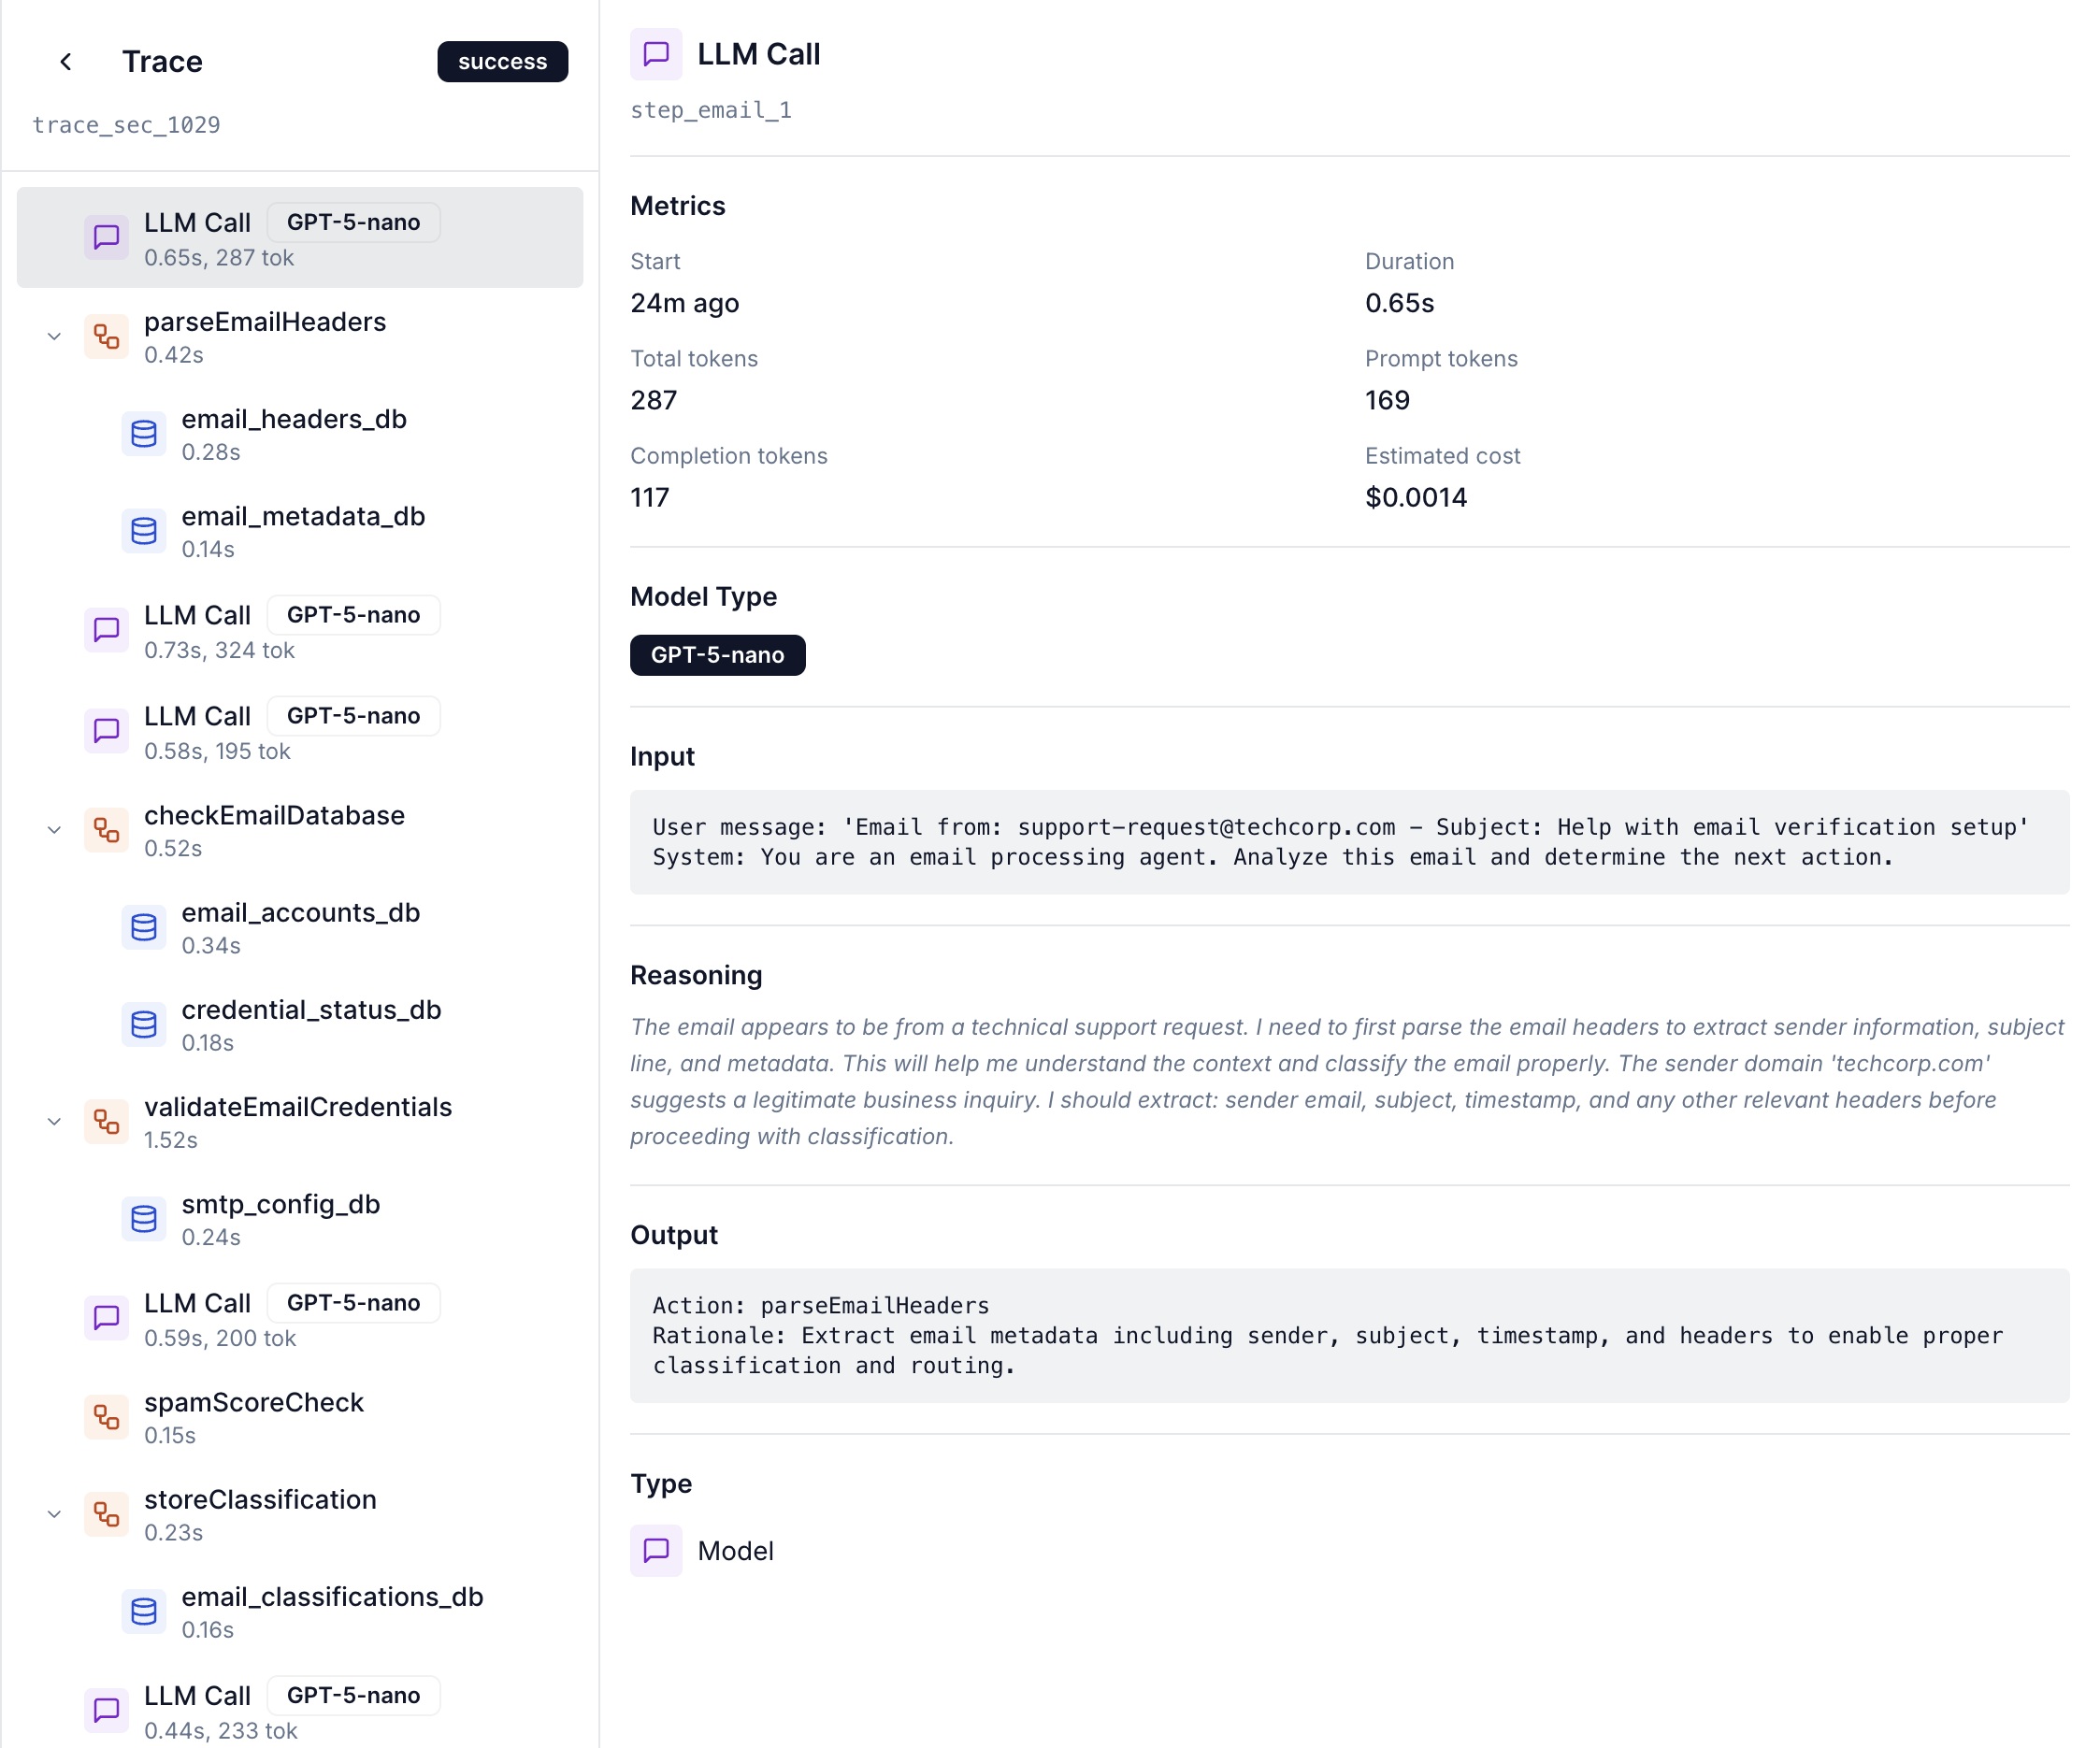
Spans: The building blocks
A span is a single unit of work within a trace. Each span represents one operation in your agent’s execution.LLM API call
Interaction with language models
Tool execution
Function and tool invocations
Reasoning step
Decision and extraction operations
Span types
Function spans
Created by thetrace_run() context manager to mark the entry point of your agent execution.
What function spans capture
What function spans capture
- Span name: Agent or function name
- Custom metadata: Task IDs, user IDs, or any contextual data
- Total execution duration: End-to-end timing
- Success/error status: Whether the execution completed successfully
LLM spans
Created automatically bywrap_llm_client() to track every interaction with language models.
Captured data:
| Attribute | Description |
|---|---|
| Model name | e.g., claude-3-5-sonnet-20241022 |
| Provider | e.g., anthropic, openai |
| Prompt text | Complete prompt and system messages |
| Completion | Full response text |
| Token counts | Input, output, and total tokens |
| Estimated cost | Calculated cost in USD |
| Latency | Response time in milliseconds |
| Streaming status | Whether response was streamed |
| Extracted reasoning | Reasoning steps if present in completion |
LLM spans work with both
messages.create() and messages.stream() methods automatically.Tool spans
Created by the@tool decorator to track function and tool executions.
Captured data:
Input and output
Input and output
- Tool name: Function identifier
- Tool description: Extracted from docstring
- Serialized input parameters: All arguments passed to the function
- Serialized output: Return value from the function
Performance and errors
Performance and errors
- Execution duration: Time taken in milliseconds
- Error details: Exception information if execution failed
Trace context propagation
Cascade SDK uses OpenTelemetry’s context propagation to maintain parent-child relationships automatically. How it works:Tool span nesting
When a
@tool decorated function is called inside a trace, the tool span becomes a child of the root span.LLM span nesting
When the tool makes an LLM call with a wrapped client, the LLM span becomes a child of the tool span.
Technical details
Data size limits
- Text values truncated at 10,000 characters by default
- Large objects serialized efficiently to JSON
- Binary data excluded from capture
Async support
Full support for async/await patterns:- Async tool decorators propagate context correctly
- Streaming LLM responses tracked incrementally
- No blocking of async event loops
Error handling
When an operation fails, the span automatically captures detailed error information. Captured error details:status_code:ERRORtool.error: Exception message- Exception event with full stack trace